Description
Best support and resistance indicator.
The key level indicator for Metatrader is the best forex trading tool that can be incorporated into different trading styles. This multi-timeframe indicator is efficient in detecting trading zones where price is likely to reverse, re-test, bounces, or breakouts. The identified zones are usually core support and resistance areas where buyers and sellers react. The indicator automatically draws the level by scanning through the charts for zones with significant price rejection plus other technical analysis.
This MT4 indicator is so powerful because it doesn’t just identify a key level on a one-time frame alone. It rather identifies a key level that is in sync with all time frames. For instance, a key level spotted by the indicator on H4 would also be valid on H1 through to the lower time frames. It’s indeed a unique trading tool.
Furthermore, it is a leading indicator and doesn’t lag behind price. So professional and novice traders would find it valuable in their trading endeavors because it prepares a trader of what to expect. You’ll also be comfortable with this MT4 indicator on your trading dashboard because it doesn’t mess up your chart. It gives you ample space to still do your technical analysis.
The key level indicator is suitable for scalping, swinging, and day/intraday trading. The indicator prepares you ahead of time for market zones that would most likely show some degree of support or resistance. Simply put, it helps you to anticipate price action opportunities which you can use to determine a trade entry or exit as the case maybe.
How To Trade With The Key Level Indicator For MT4
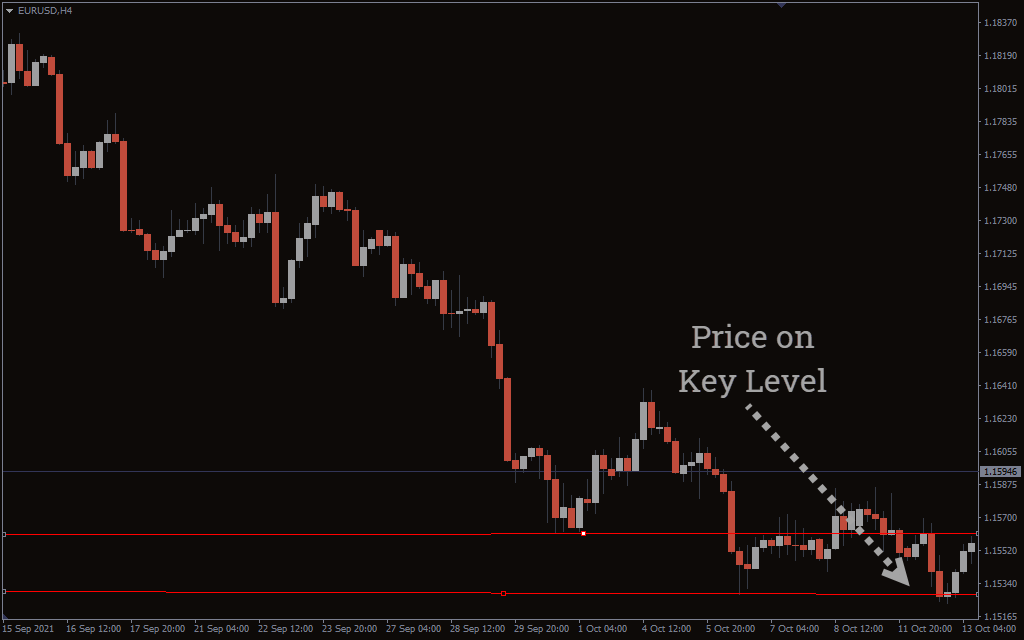
The above chart shows how the key level indicator looks on a forex dashboard. The indicator can either be used as a stand-alone indicator or as a confluence with your regular trading strategy. The first approach is to take note of the key levels identified by the indicator on a currency pair and observe how price reacts when it gets to the zone. The above picture is a good setup for a BUY signal because the price got rejected when it touched the key level identified by the indicator. Take a look at the chart below for the BUY entry.
Once you notice a significant price rejection on a higher time frame, you may quickly switch to the lower time frame for an entry opportunity. You must allow price action to guide your BUY/SELL decision.
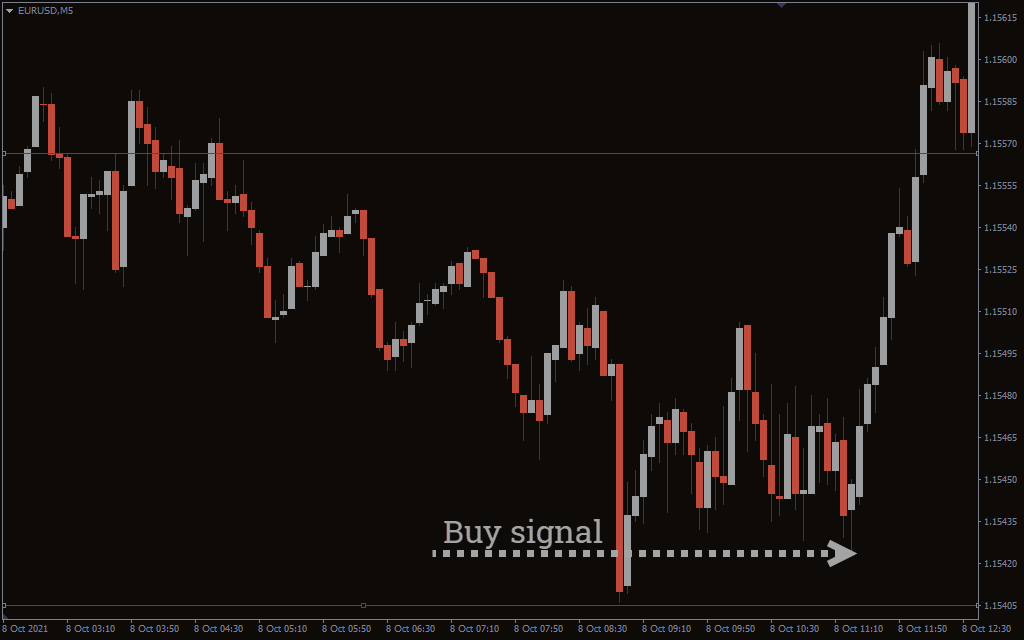
The above chart is the lower time frame (M5). You would have taken a BUY trade after the third price rejection. This illustration only demonstrates how to scalp on a lower time frame with the key level indicator.
Conclusion
The key level indicator for MT4 is designed to help you make an informed trading decision at the right zones. It saves the stress of searching for key tradable levels on your chart.
100% Satisfaction Service
if you have any qusetion, please contact us at time, provide friendly service
EBOOKLOVERS™ 6-STEP SATISFACTION GUARANTEE
1. No Risk, 30-Day Money-Back Guarantee.
2. 100% Quality Inspection on every order.
3. FREE Shipping. No surprises or hidden fees.
4. Safe Payments via Credit/Debit Card or PayPal®
5. McAfee™ and SSL secured shopping cart.
6. lifetime customer support.
Payment & Security
Your payment information is processed securely. We do not store credit card details nor have access to your credit card information.


