


Descrição
The trend reversal indicator draws two EMAs on the chart to show the course of price action.
The trend market reversal indicator for MT4 simply plots two EMAs to present you with a direction of the trend.
The indicator comprises two EMAs; one with the faster period and the other with the slower period. When there is a downward trend reversal, the slower EMA crosses above, the faster one. Conversely, when there is a downward reversal, the faster EMA crosses above, the slower one.
The two EMAs are known as Signal-up and down EMAs. As the name suggests, one EMA signals upward momentum, and the other shows downward push.
Using the indicator, you can find multiple trading opportunities, giving multiple entries and exit points.
How to trade the trend market reversal indicator?
The trend reversal indicator works like any other trend reversal indicator. It plots two EMAs, and when the crosses happen, the indicator shows a potential reversal.
What makes the indicator unique is both EMAs shows signal up and down. It means that if there is an uptrend, and there is a possibility of a trend reversal, the signal-down line will take charge and go above the other one.
On the other hand, the signal-up line will go above the other one when there is a downtrend.
A key point to add here is both EMAs magnifies signal-up and down. Therefore, when there is a possibility poof a trend reversal, both the EMAs will shift their gears accordingly.
Let’s find out the buy and sell strategy for the indicator:
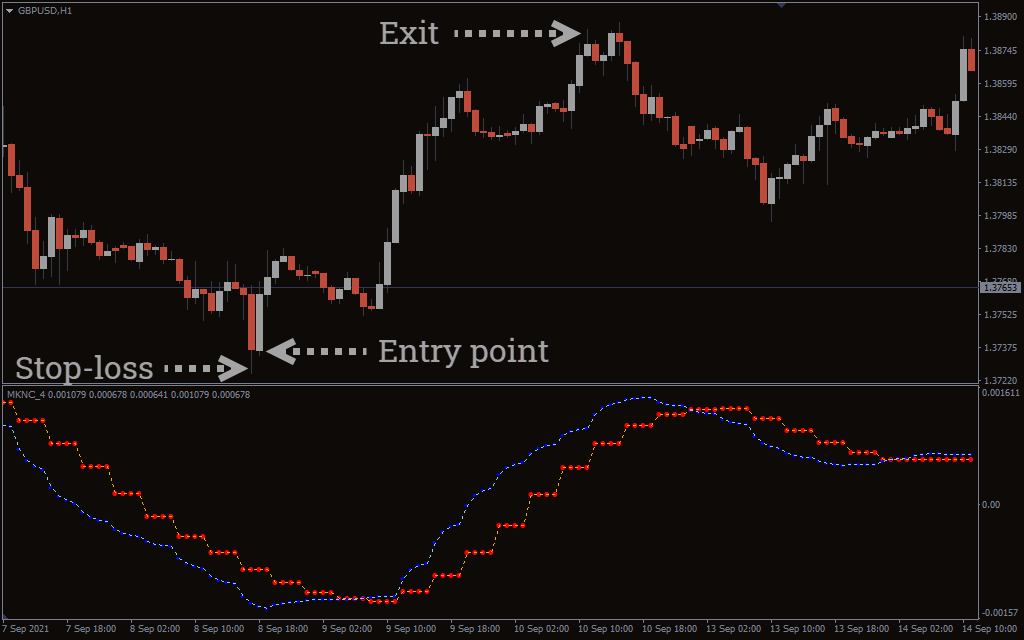
Trend market reversal indicator buy strategy
- The signal-up line must cross above the signal-down line.
- Wait for the signal-up line to cross above fully.
- Enter the trade when the two lines meet each other.
- Place a stop-loss near the low of a buying point.
- Exit the trade when the trend changes its path.
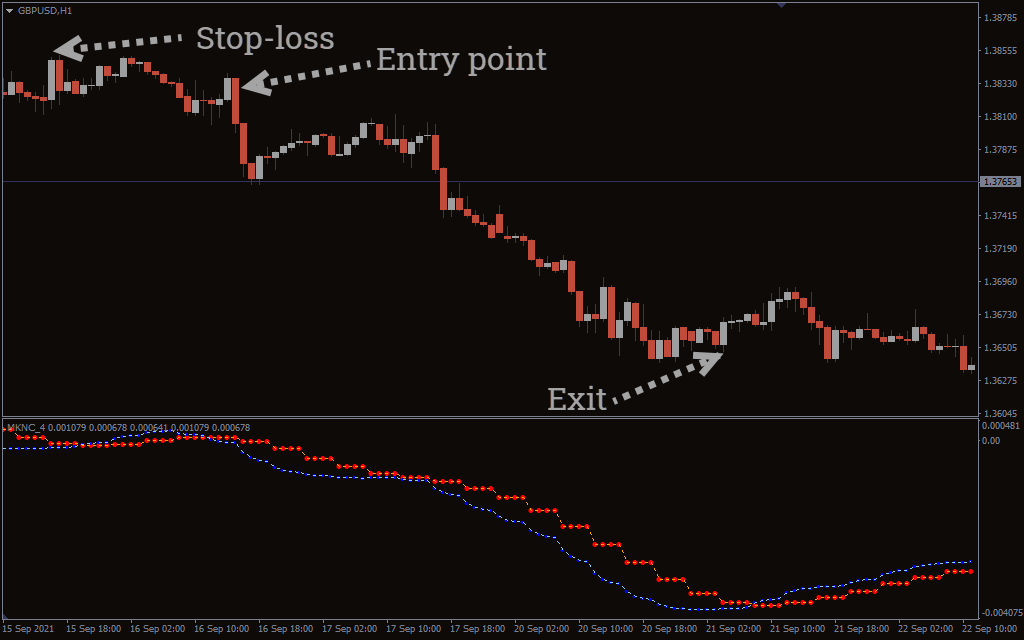
 Trend market reversal indicator sell strategy
- The signal-down line must cross above the signal-up line.
- Wait for the signal-up line to cross above fully.
- Enter the trade when the two lines meet each other.
- Place a stop-loss near the low of a buying point.
- Exit the trade when the trend changes its path.
Conclusion
The trend reversal indicator is handy for detecting the potential reversal. By using the indicator, you can pinpoint exact entry and exit points.
You can apply the trend reversal indicator on any timeframe. You can also combine the indicator with other forms of technical analysis like chart patterns and oscillators like the RSI or Stochastics.
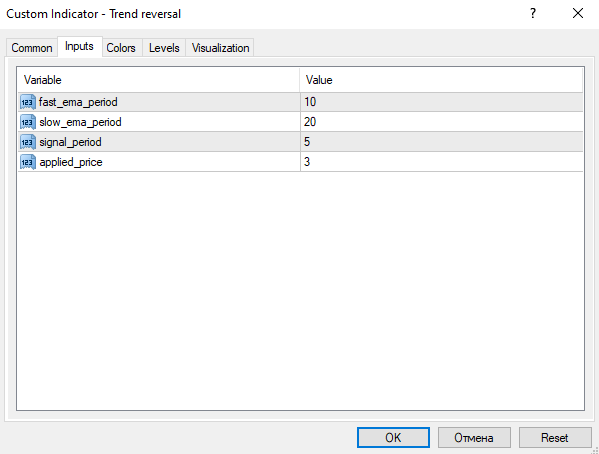
fast_ema_period: The default value is 10. It is the value of faster EMA.
slow_ema_period: The default value is 20. It is the value of slower EMA.
signal_period: The default value is 5. It is the value of signal up and down.
applied_price: The default value is 3. It is the value of applied EMAs on the price action.
100% Satisfaction Service
if you have any qusetion, please contact us at time, provide friendly service
EBOOKLOVERS™ 6-STEP SATISFACTION GUARANTEE
1. No Risk, 30-Day Money-Back Guarantee.
2. 100% Quality Inspection on every order.
3. FREE Shipping. No surprises or hidden fees.
4. Safe Payments via Credit/Debit Card or PayPal®
5. McAfee™ and SSL secured shopping cart.
6. lifetime customer support.
Payment & Security
Suas informações de pagamento são processadas com segurança. Nós não armazenamos dados do cartão de crédito nem temos acesso aos números do seu cartão.