Descrição
In this strategy, we will be trading a reversal strategy which makes use of price action, support and resistance levels, as well as candlestick patterns. However, we will be using technical indicators which can act as tools to help us identify such key support and resistance levels, as well as the entry signals associated with reversals from these levels.
Swing Highs and Swing Lows as Support and Resistance
Swing Highs and Swing Lows are key levels where the market had a drastic price reversal. It is at these points where the market would either temporarily see a price level as being too high or too low, which would often lead to a sell off or a buyout. This then causes price action to reverse to the opposite direction thus forming the swing highs or the swing lows.
Since swing highs are price levels which the market saw as being too high, there is a high chance that the market would still view it as being too high as price revisits these levels. For this reason we could also assume that swing highs are possible horizontal resistance levels where price may bounce back down from.
On the other hand, swing lows are price levels which was considered being too low. For the same reason price reversed on swing highs, price may also bounce back up on swing lows. So, we could also assume swing lows as possible horizontal support levels.
Zigzag Color Indicator
The Zigzag Color indicator is a technical indicator which identifies swing highs and swing lows on a price chart. It does this by identifying points wherein price has reversed against a prior market pulse by a percentage greater than the predetermined percentage value. It then connects these points with straight lines which help accentuate the peaks and troughs of the market’s swing highs and swing lows. This also gives the chart a visual characteristic with a zigzag like pattern, thus it is called the Zigzag indicator.
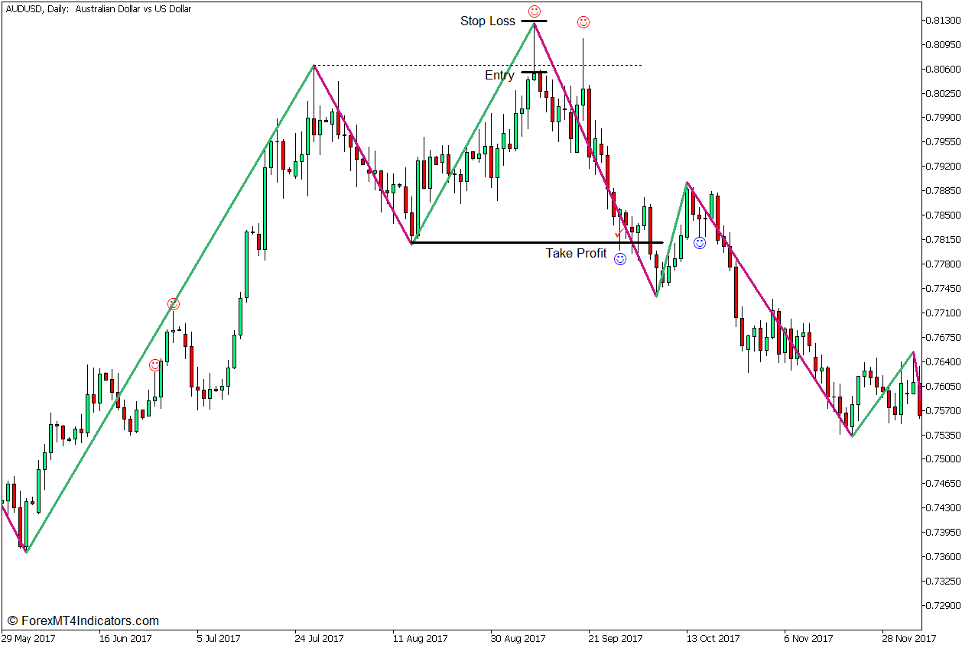
This version of the Zigzag indicator also plots its lines in two colors. Lines connecting a swing low to a swing high are color medium sea green, while lines connecting swing highs to swing lows are color medium violet red.
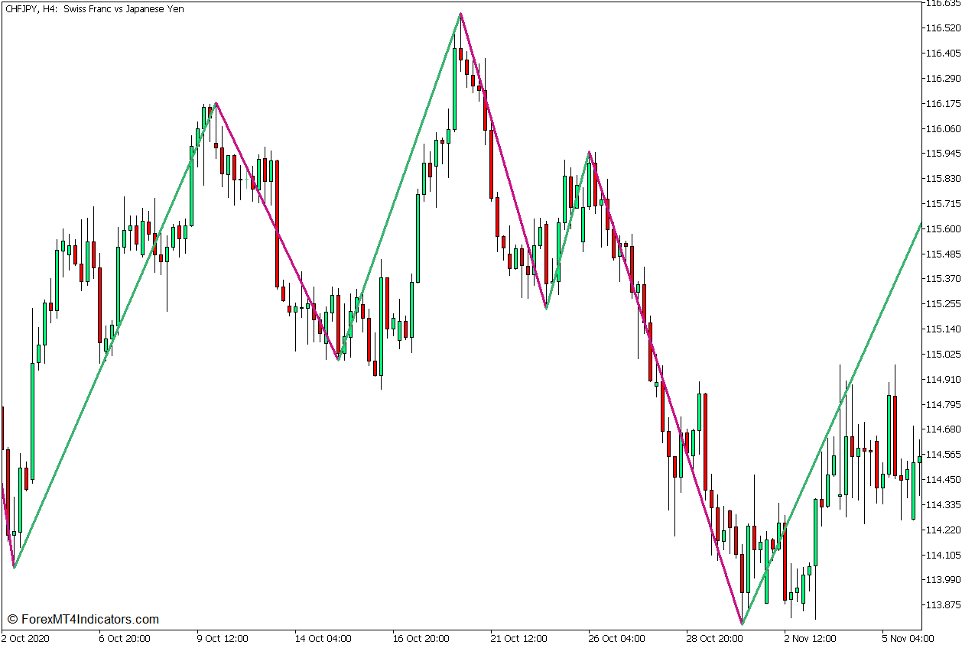
Given that the Zigzag Color indicator identifies key swing highs and swing lows, we will use this indicator to identify possible horizontal support or resistance levels where price may bounce back from.
Pin Bars
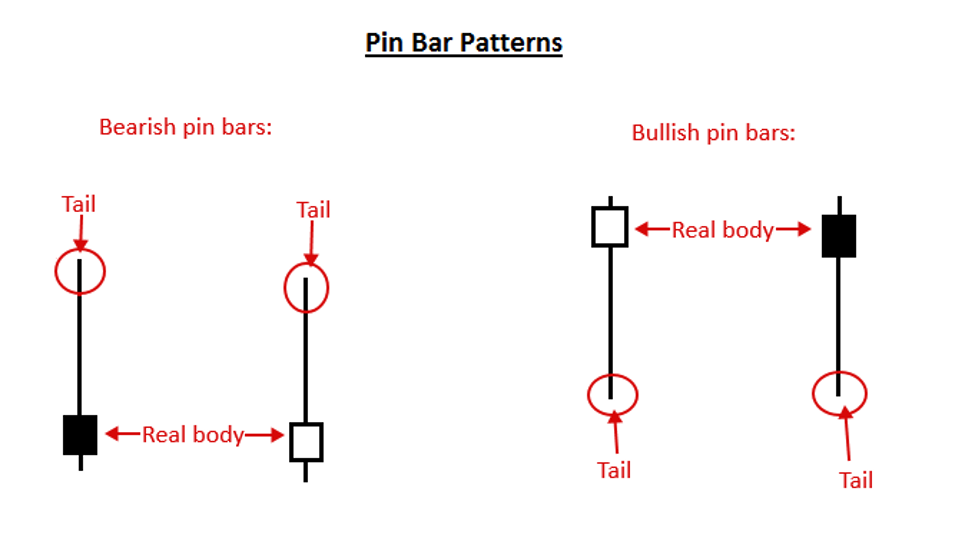
Pin Bar patterns are high probability reversal candlestick patterns. Price action tends to reverse whenever a pin bar pattern form.
Bullish pin bar patterns are characterized by long wicks at the bottom of its body and a small body at the top. This pattern indicates price rejection of the price levels below the candle. Bullish pin bar patterns pushing against a support level tends to reverse upward more often.
Bearish pin bar patterns on the other hand are the exact opposite. It has long wicks at the top with small bodies at the bottom indicating a price rejection on the area above it. Bearish pin bar patterns pushing against a resistance level also tends to reverse down often.
Pin Bar Detector
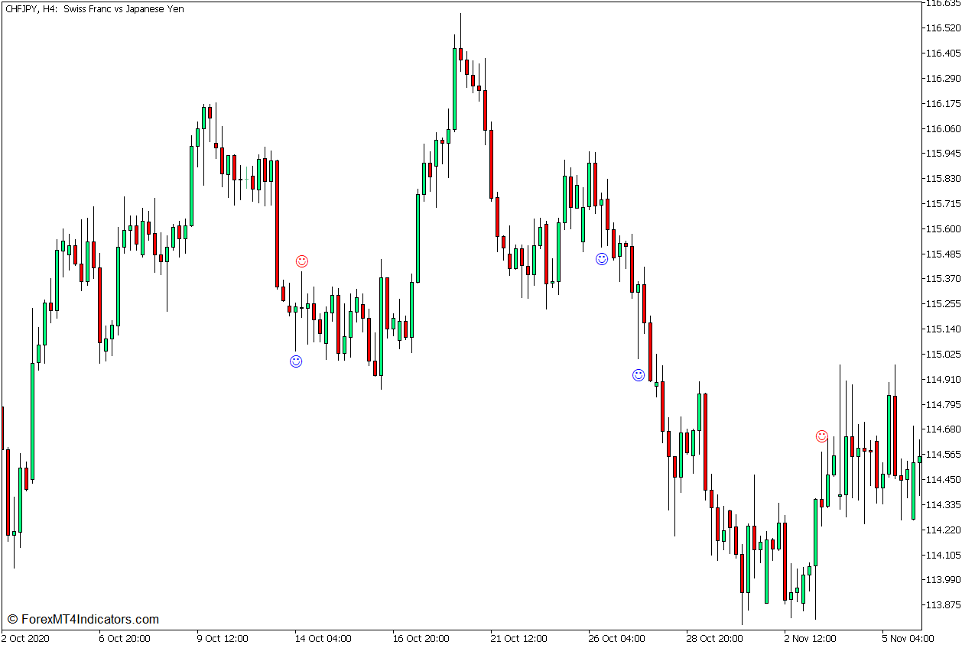
The Pin Bar Detector Indicator is a custom technical indicator which automatically identifies pin bar patterns. It plots a lime smiley below the candle whenever it identifies a bullish pin bar pattern, and a red smiley above the candle whenever it detects a bearish pin bar pattern. However, we have modified this indicator to plots a blue smiley whenever it detects a bullish pin bar pattern for easier identification on a white background.
Trading Strategy Concept
This trading strategy is a simple reversal trading strategy which trades reversal signals developing on a horizontal support or resistance level based on a swing high or swing low price point.
The swing highs and swing lows are objectively identified based on the Zigzag Color Indicator. These swing highs and swing lows are then used as a basis for identifying the horizontal support and resistance levels where we will be anticipating potential reversal signals.
The Pin Bar Detector Indicator is then used to confirm the reversal signal developing on the horizontal support or resistance level.
Buy Trade Setup
Entry
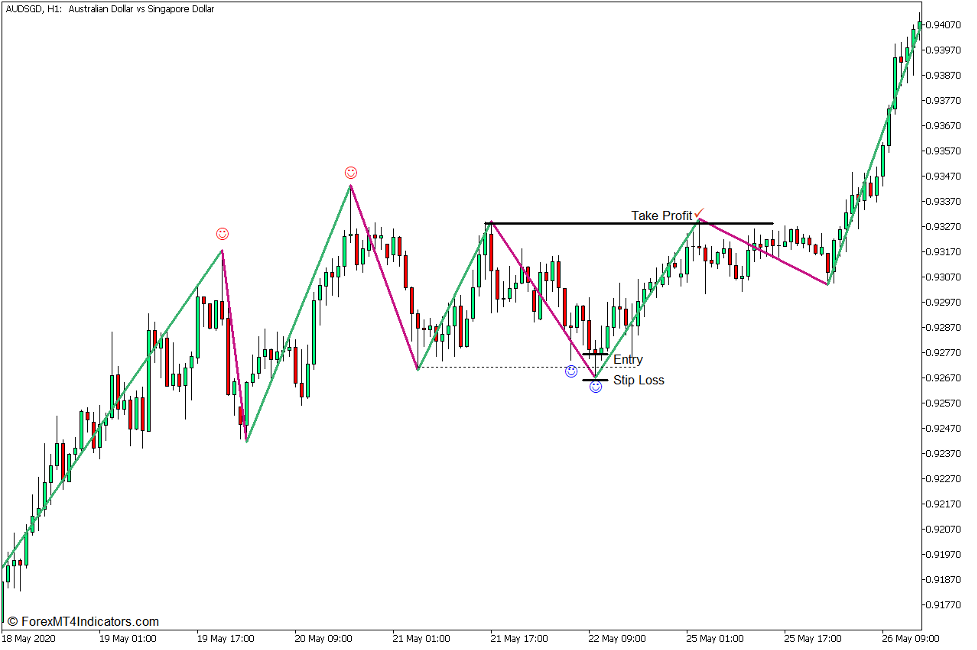
- Identify a horizontal support level based on the swing low indicated by the Zigzag Color indicator.
- Wait for the Find Pin Bars indicator to identify a bullish pin bar pattern pushing against the horizontal support level.
- Open a buy order as soon as soon as the bullish pin bar pattern is confirmed.
Stop Loss
- Set the stop loss at the support level below the entry candle.
Exit
- Set the take profit target at the most recent swing high.
Sell Trade Setup
Entry
- Identify a horizontal resistance level based on the swing high indicated by the Zigzag Color indicator.
- Wait for the Find Pin Bars indicator to identify a bearish pin bar pattern pushing against the horizontal resistance level.
- Open a sell order as soon as soon as the bearish pin bar pattern is confirmed.
Stop Loss
- Set the stop loss at the resistance level above the entry candle.
Exit
- Set the take profit target at the most recent swing low.
Conclusion
Pin Bar Patterns are high probability reversal candlestick patterns. However, it should not be traded haphazardly at any location on the price chart. Where these patterns form is crucial. Pin bar patterns forming on support or resistance levels tends to work better than patterns that form on a void in the chart. This is because there is a support or resistance level that it is pushing against.
This strategy simply puts structure in a trade setup which many range traders already do and simplifies the process with the use of the Zigzag Color indicator and the Find Pin Bars indicator.
Forex Trading Strategies Installation Instructions
Zigzag Support and Resistance Pin Bar Bounce Forex Trading Strategy for MT5 is a combination of Metatrader 5 (MT5) indicator(s) and template.
The essence of this forex strategy is to transform the accumulated history data and trading signals.
Zigzag Support and Resistance Pin Bar Bounce Forex Trading Strategy for MT5 provides an opportunity to detect various peculiarities and patterns in price dynamics which are invisible to the naked eye.
Based on this information, traders can assume further price movement and adjust this strategy accordingly.
How to install Zigzag Support and Resistance Pin Bar Bounce Forex Trading Strategy for MT5?
- Download Zigzag Support and Resistance Pin Bar Bounce Forex Trading Strategy for MT5.zip
- *Copy mq5 and ex5 files to your Metatrader Directory / experts / indicators /
- Copy tpl file (Template) to your Metatrader Directory / templates /
- Start or restart your Metatrader Client
- Select Chart and Timeframe where you want to test your forex strategy
- Right click on your trading chart and hover on “Template”
- Move right to select Zigzag Support and Resistance Pin Bar Bounce Forex Trading Strategy for MT5
- You will see Zigzag Support and Resistance Pin Bar Bounce Forex Trading Strategy for MT5 is available on your Chart
*Note: Not all forex strategies come with mq5/ex5 files. Some templates are already integrated with the MT5 Indicators from the MetaTrader Platform.
Payment & Security
Suas informações de pagamento são processadas com segurança. Nós não armazenamos dados do cartão de crédito nem temos acesso aos números do seu cartão.
You may also like


